Hi everyone
This is more curiosity then anything.
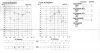
I was looking over my old hearing test graphs (sorry i don't know the correct names) and I was just wondering if anyone could explain them to me.
I have a left sided moderate hearing loss in low and high frequencies and a right sided moderate hearing loss in low and mild frequencies if that helps?
With hearing aids i hear 94% without the hearing aids i only hear 32%
Thank you for any input")
This is more curiosity then anything.
I was looking over my old hearing test graphs (sorry i don't know the correct names) and I was just wondering if anyone could explain them to me.
I have a left sided moderate hearing loss in low and high frequencies and a right sided moderate hearing loss in low and mild frequencies if that helps?
With hearing aids i hear 94% without the hearing aids i only hear 32%
Thank you for any input